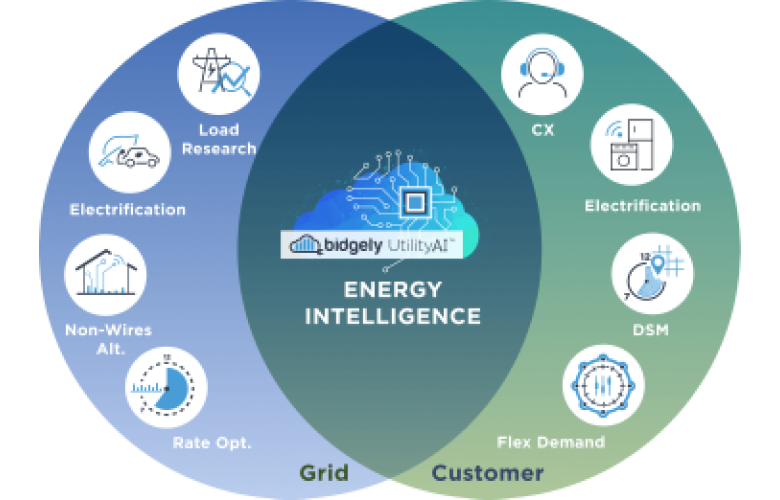
Harness Bidgely’s industry leading CX solution to manage the demand flexibility by using behind the meter (BTM) customers' assets. It all starts with knowing who has what BTM assets and when do they use them to understand how much flexibility each individual home can contribute back to the grid. Our CX has recently advanced from behavior actions to controlling the large assets so we optimize both customer bills as well as grid balance at the lowest cost per kW.
Why do we need Demand Flexibility?
The supply and demand curve are fast falling out of sync. Renewables make the supply curve follow mother nature a lot more than the previous generation supply curve. The advent of mass scale EVs followed by solar and batteries make the demand curve have a mind of its own independent of the supply side equation. The future of Grid Resiliency depends on keeping these two in sync. Since mother nature cannot be controlled, neither can we deploy virtually infinite batteries at the utility scale, the answer to this puzzle is to manage the demand curve to align at mass scale in a cost effective way.
It is no secret that customer and grid have to come together in order to make Behind-The-Meter customer assets part of the grid to survive in future. Bidgely’s Flex Demand brings a two tiered solution to the utilities:
It is no secret that customer and grid have to come together in order to make Behind-The-Meter customer assets part of the grid to survive in future. Bidgely’s Flex Demand brings a two tiered solution to the utilities:
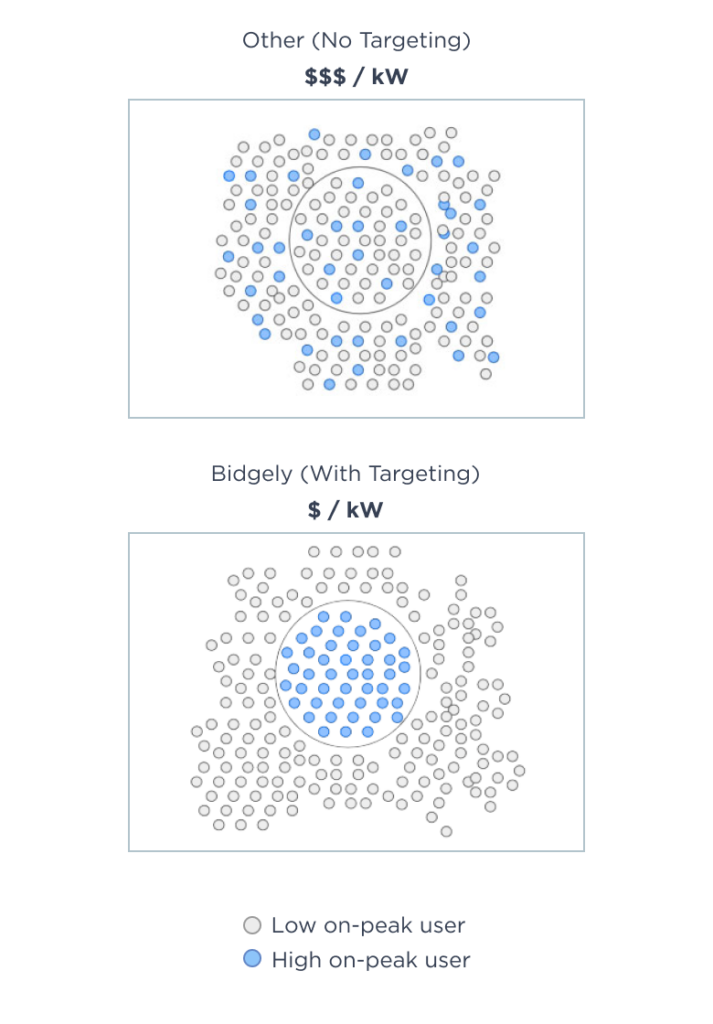
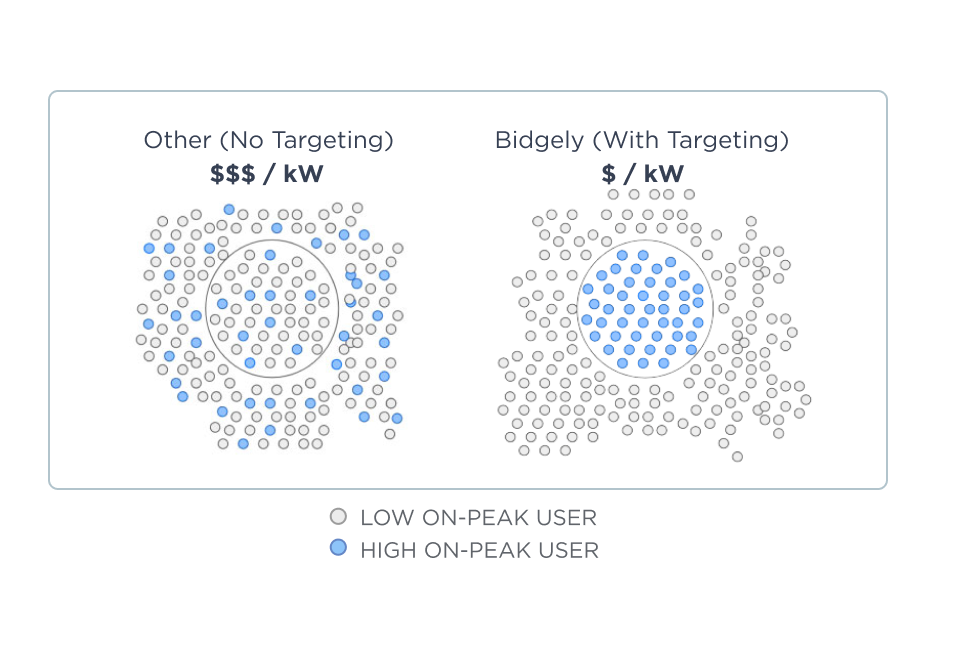
Understand & Target
Firstly, understanding who has what loads behind the meter and when they are used. This includes the traditional large appliances like HVAC, water heaters, pool pumps etc. It also includes DER loads like EV, Solar and batteries. This allows an assessment of the amount of load flexibility this home brings to the table knowing what are the areas when the grid needs help.
Secondly, we layer two types of load shifting - perpetual load curve shape shift (with TOU rates) and peak load reduction (with BDR, EV Managed charging and more). We offer Behavior Demand Response, Whole home and EV TOU rate enrollment and coaching, and EV managed charging.
Whole Home Time of Use Behavior Shift
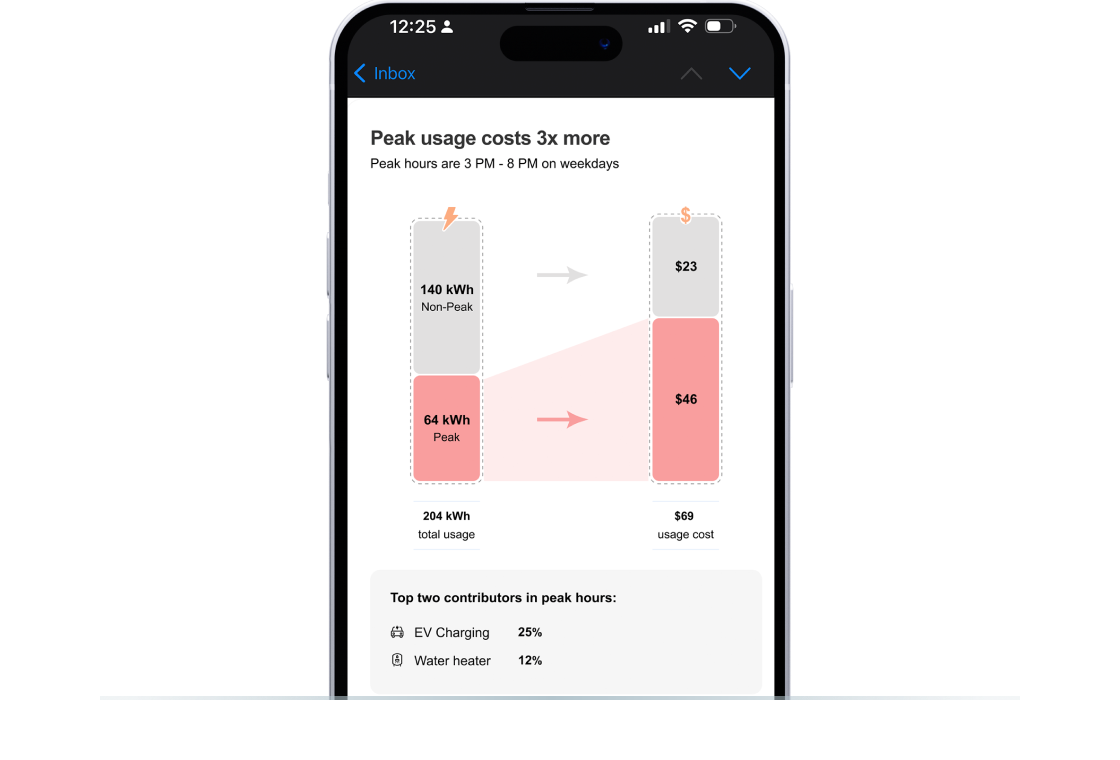
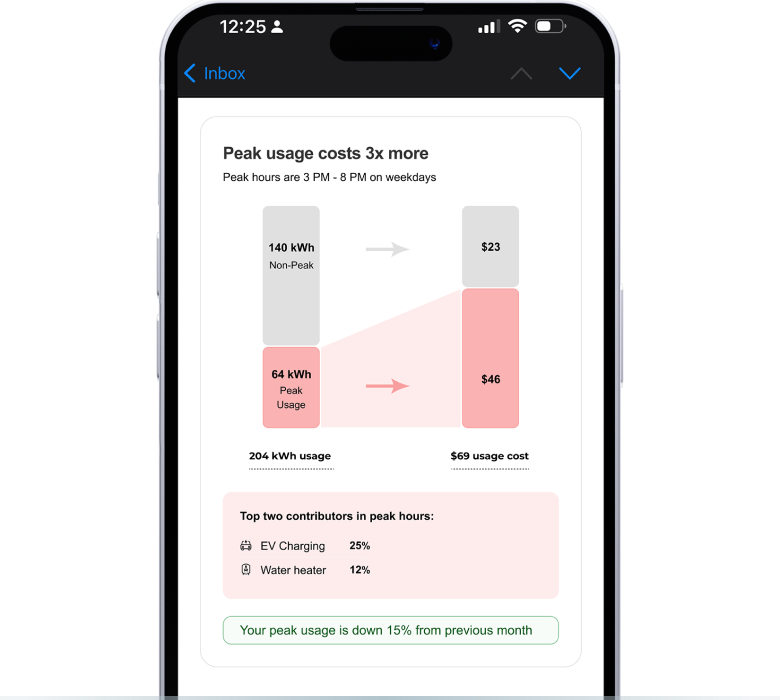
Time of use rates are an effective way to motivate customers to use energy in a certain way. Issues utilities face in implementing effective TOU rates are either too low spread between peak and off peak OR too low enrollment into the rate plans. We created an effective TOU enrollment with personalized calculators and TOU rate coaching post transition helping customers understand what appliances they are running in peak hours and quantify the savings realized with the shift. Time of Use provides the baseline of load shift making the load curve perpetually shift to align with clean energy supply.
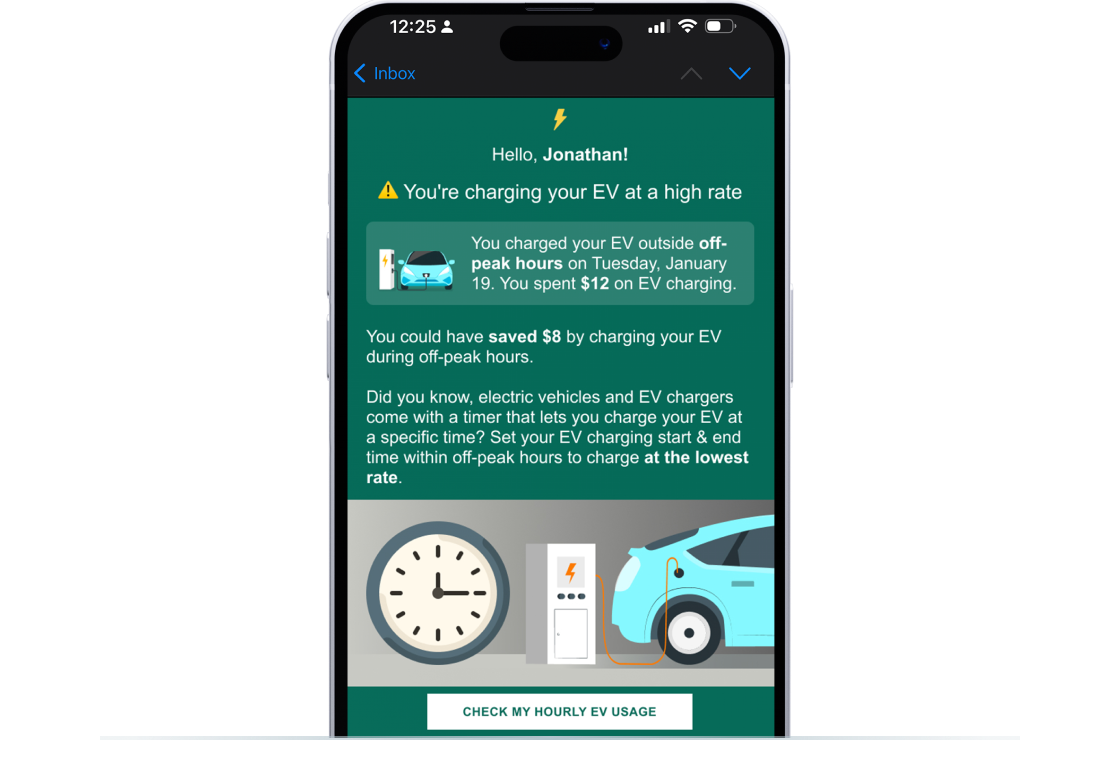
EV-Time of Use Behavior Shift
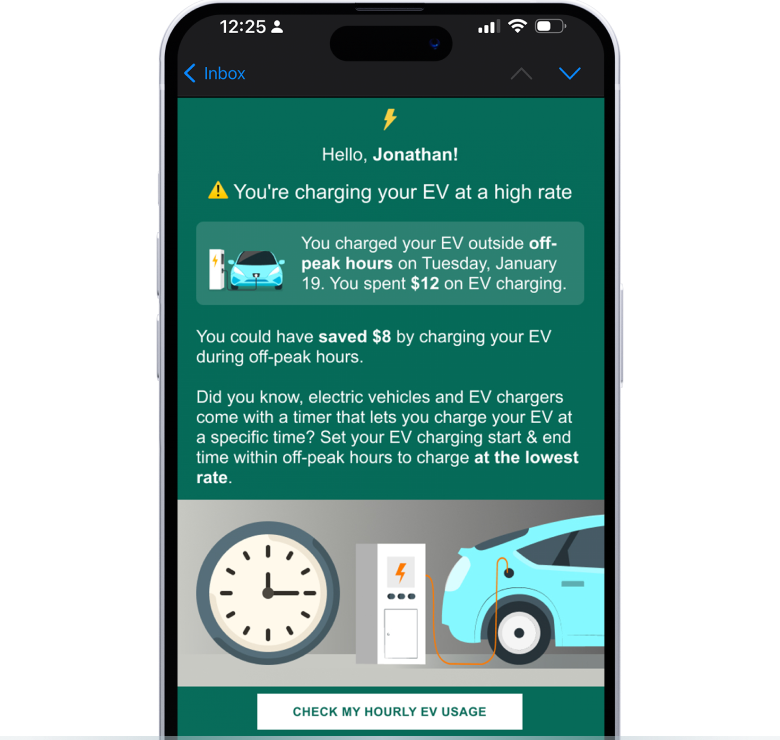
Our patented near real time EV disaggregation can identify all who have EVs and target those customers to, increase EV TOU enrollment and send peak charging alerts - all using the AMI data and behavior nudges.
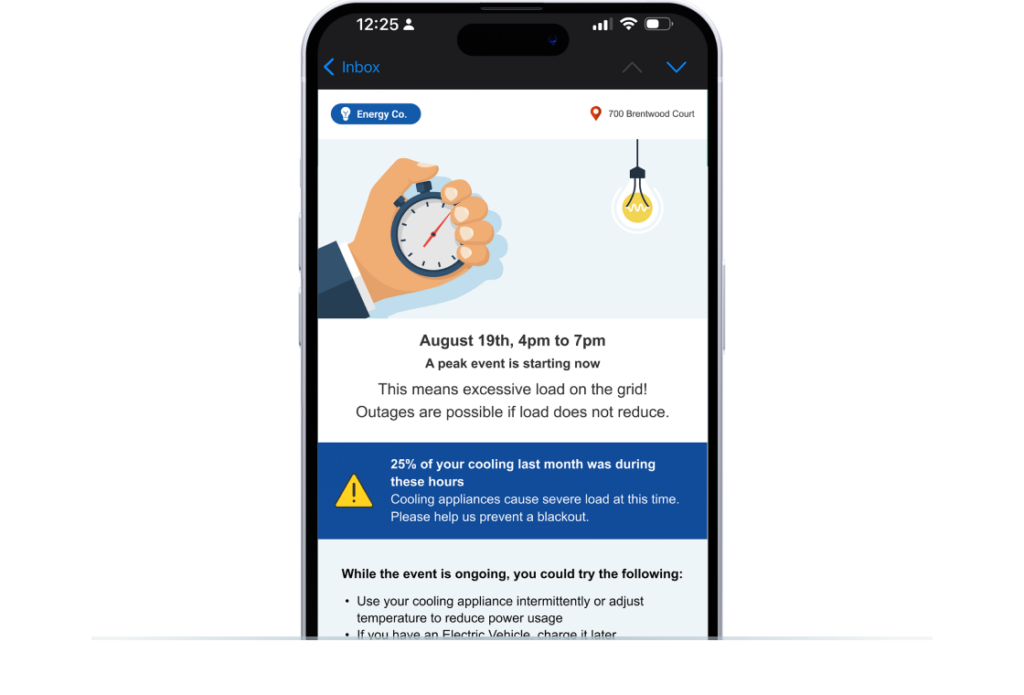
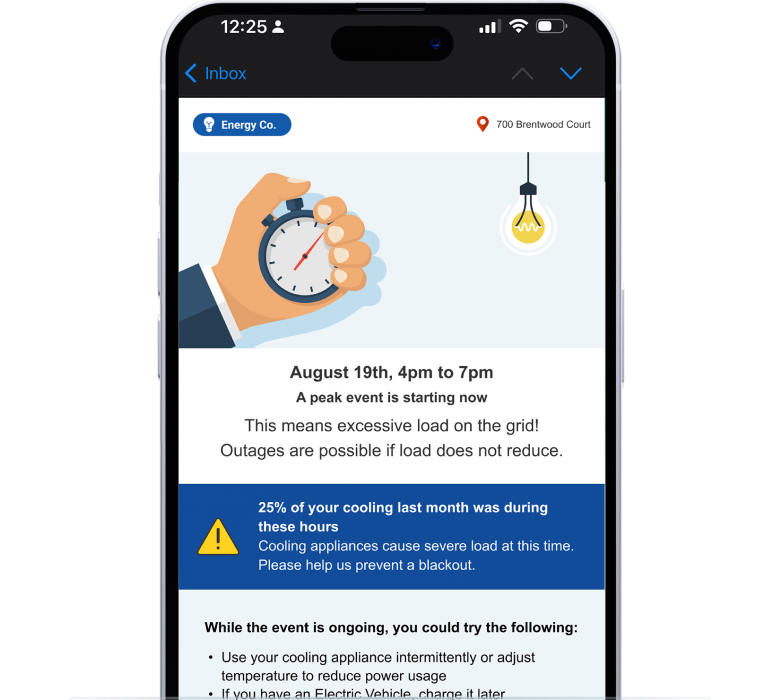
Behavior Demand Response (BDR)
BDR is a proven and cost effective peak reduction - applies to most homes, is 100% performance driven for customer incentive and provides a layer on top of baseline load shift on the days when events are called.
EV Managed Charging
EV Managed Charging adds a hybrid layer between perpetual load curve shift and calling peak events. Includes the controls for charging hours and can dynamically change based on location and how many other EVs are charging at the same time under the same transformer.
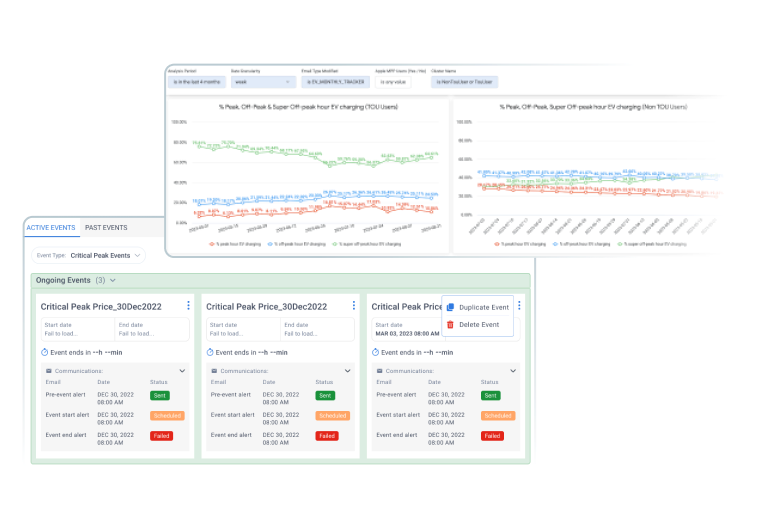
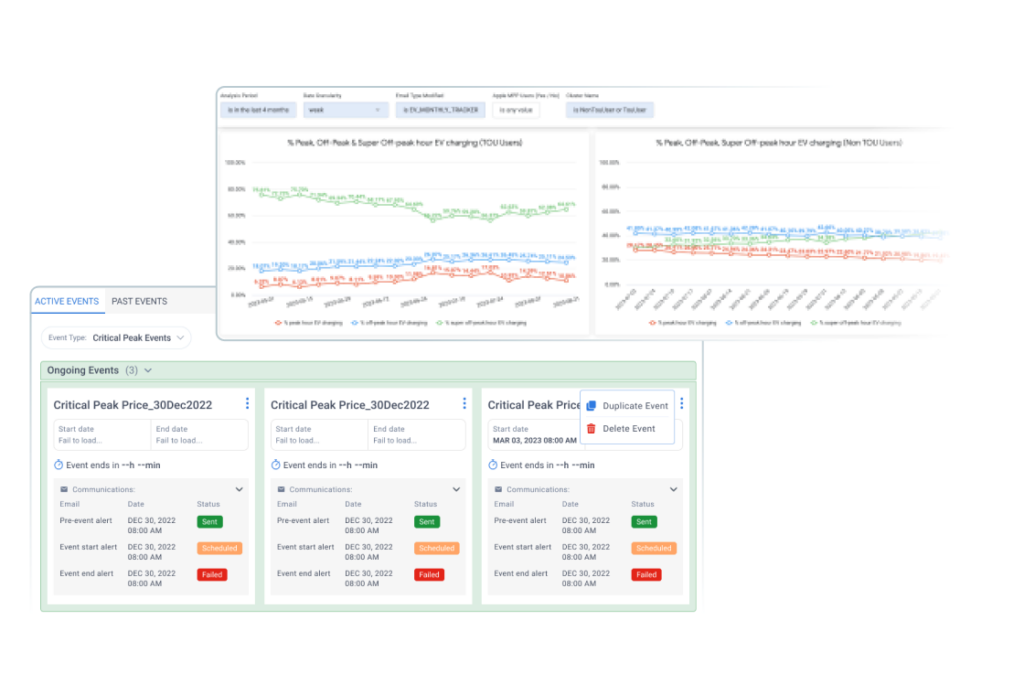
Event Console and M&V
Complete the Solution with Event Console and M&V. Add to the solution our Event Console that gives utilities independent control to call events, and our M&V dashboards that show the load shifting clearly for the whole house and by appliances.
Our Results Speak for Themselves
TOU Rate Enrollment
5% enrollment rate in the first 3 months of the program
TOU-Based Load Shift
35-40% On-peak EV Charging Reduction with TOU Transition
5-10% On-peak EV Charging Reduction with TOU Coaching
Increased Engagement & CSAT
75% email open rate increase
55% click-through rate increase
76% positive feedback rate
EV Managed Charging Load Shift
75% of users on TOU rate charge their vehicle during off-peak hours.