Across the industry, utilities are embracing the need to make more data-driven decisions. 

However, the challenge lies in isolating the right data that truly aids decision-making, while recognizing that more data doesn’t necessarily equal better data or lead to better outcomes. Utility decision-makers require access to more meaningful datasets that are designed to quickly surface relevant and actionable insights that will deliver improved results for their grid, their customer relations and their bottom-lines. 

Bidgely’s next generation business intelligence platform streamlines the process of gathering relevant insights about your customers and your grid so you can achieve better outcomes. This includes being able to more confidently plan grid optimization that accounts for DER adoption and demand-side shocks, and uncovering untapped opportunities for load management

Data that Makes a Difference. Bottom-up hourly end-use demand data. 

Utility users can now use the platform to analyze end-use demand data and understand which appliances customers are using at every hour in the day. This data can be used to  answer complex questions such as “how do customers respond to weather shocks compared to prolonged extreme weather and in these two scenarios which appliances are they turning on and when.” 

An essential tool in a utility user’s toolbox, is an 8760 demand curve. An 8760 curve plots energy usage for every hour of every day for the entire year (24 hours x 365 days = 8760 points). These curves are used to analyze customers’ yearly consumption patterns and manage peak demand in the coming years. 

Analytics Workbench 2.0 provides utility users with two 8760 curves that help them understand true customer behavior and grid capacity impacts. 

8760 Demand – Total Consumption Over 12 Months

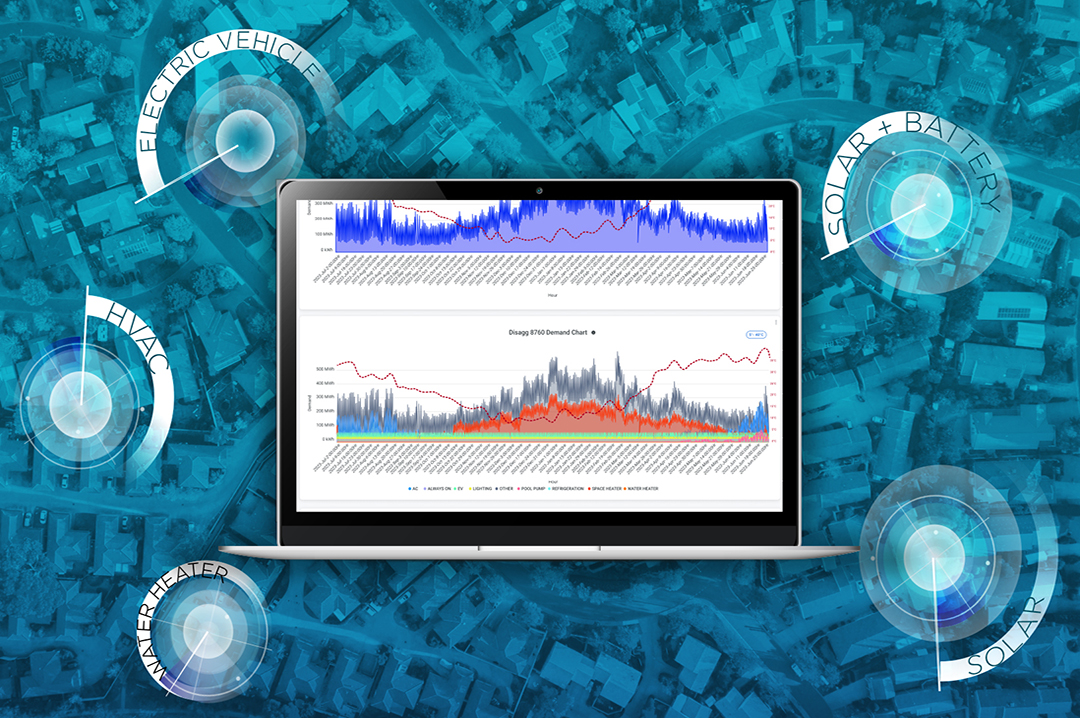
The first 8760 curve visualizes total consumption over the year so users can analyze seasonal consumption trends and anomalies. Users can quickly review system-wide 8760 demand curves as well the 8760 for each transformer, feeder, substation, etc. This empowers utilities with the information they need to know what is happening on their grid at all times.

8760 Demand – Disaggregated Consumption Over 12 Months

The second 8760 reflects end-use demand for every hour in the day. These end-use categories include EVs, heating, cooling, pool pumps, refrigeration, etc. Understanding how customers use energy at every hour in a day across the year provides utility users with a wealth of knowledge. Decision makers can quickly reference this hour-by-hour appliance curve to answer questions such as:

  • ”Which appliances are driving peak loads across each season?”
  • “Which customers are charging EVs during critical peak hours events”; and
  • “How do I expect future DER adoption to affect my grid?”

Driving Informed Decisions

Utility decision makers face the challenge of answering complex questions and acting upon their conclusions with limited margin for error. Thus, it is crucial for them to have access to the right datasets, enabling them to ask the right questions, conduct meaningful analyses, and make informed decisions that drive tangible benefits to the grid and to their customers. 

Analytics Workbench is specifically designed to provide decision makers with the necessary data and information required to effectively manage today’s energy transformation and anticipate the challenges of tomorrow.