
How Bidgely Grid Intelligence turns AMI data into measurable, distribution-level flexibility for right-sizing infrastructure investment
When PJM Interconnection warned of an imminent electricity reliability emergency on June 30, 2026, the U.S. Department of Energy issued two emergency orders under Section 202(c) of the Federal Power Act. One order authorized PJM to dispatch specified generation units as needed to maintain reliability. The other authorized PJM to direct backup generation resources at data centers and other large-load customers as a last resort before declaring, or during, an Energy Emergency Alert 3.
The orders came as PJM was forecasting near-record summer demand. As of July 2, PJM expected peak load to reach 166,241 MW, above its 2006 summer hourly integrated peak of 165,563 MW. The forecast held up: PJM’s post-event review puts the July 2 peak, adjusted for demand response performance, at approximately 168,158 MW — a new all-time record, surpassing the 2006 mark. What conservation and demand response changed was the load PJM actually had to deliver. Instantaneous served load reached roughly 162,700 MW, about 6 GW below the demand-response-adjusted peak, keeping the grid within its operating limits during the event.
PJM’s emergency was, first and foremost, a bulk-system event driven by extreme heat, tight operating conditions, generator outages, transmission congestion, high prices, and demand approaching record levels.
For distribution utilities, the relevant takeaway is not to reclassify the event as a distribution emergency. It is to ask where local flexibility has the potential to provide relief when these system conditions translate into feeder, transformer, or substation stress.
The reality is, the grid may have more available headroom than utilities can currently see.
That headroom is not sitting in one place. It is embedded across customer load, local assets, and the distribution edge. It is in air conditioning, EV charging, water heating, pool pumps, commercial buildings, distributed energy resources, batteries, and other flexible end uses. Managed well, it’s possible to reduce, shift, shed, generate, or modulate that load during the hours that matter most.
But utilities cannot use flexibility they cannot locate, quantify, prioritize, or verify.
Bulk-grid emergencies create distribution-level consequences
The PJM event was triggered at the bulk-system level, but the implications do not stop at the transmission interface.
Reuters reported that PJM was managing generator outages, overloaded transmission lines, and surging air-conditioning demand during the heatwave. It also reported that spot wholesale electricity prices in the Mid-Atlantic and Dominion areas surged beyond $2,500/MWh, compared with roughly $40/MWh when PJM is not in distress.
Those are bulk-system indicators, but the operating pressure becomes local very quickly. Heat-driven air-conditioning load concentrates by neighborhood. EV charging clusters on specific feeders and transformers. Large commercial and industrial loads can create localized peaks. Distributed energy resources may help, but only if the utility knows where they are, how they behave, and whether they are available during constrained windows.
A megawatt of flexibility is not equally valuable everywhere. A load reduction on one feeder may relieve a constrained transformer. The same reduction elsewhere may do little for the local asset under pressure.
That is why the next stage of demand flexibility cannot be managed only as a system-wide emergency program. It has to become location-aware grid headroom.
Sustained peaks stress the assets, utilities often cannot see clearly enough
Distribution assets are planned around expected load shapes, diversity assumptions, and historical peaks. But summer heat domes change the shape of the problem.
A normal summer peak may allow assets to cool overnight. A sustained heat event compresses or eliminates that recovery window. Air conditioning runs longer. Evening demand stays elevated. EV charging may add load during the same constrained hours. The result is not just a higher system peak; it is repeated local stress on feeders, transformers, and substations.
The uncomfortable reality is that many utilities still lack granular, asset-level visibility below the substation, especially at the transformer and customer-load-driver level. They may know where system load is rising, but not which customers are driving a local constraint, which end uses are flexible, or which assets could be relieved through targeted programs.
That visibility gap matters because the most valuable headroom is often hidden in plain sight.
It is already connected to the grid. It is already visible in AMI data. But it is not yet translated into actionable flexibility.
Emergency response is not the same as a headroom strategy
System-level emergency actions are designed to keep the bulk grid balanced during stressed conditions. They are necessary, but they do not identify which distribution assets are carrying local peak risk or which customer loads could relieve them.
For distribution planning, the relevant question after an event like this is more specific:
Which feeders, transformers, and substations experienced stress - and where is flexible load available to create relief on those assets?
That is the difference between reactive curtailment and proactive grid intelligence.
Reactive curtailment asks:
Who can reduce load right n?
Headroom discovery asks:
Which loads can flex, where are they located, which constraints can they relieve, and how much value can they create?
That second question is where utilities can move from emergency response to grid planning, from broad programs to targeted action, and from unknown flexibility to measurable local capacity.
The market is already moving toward flexible load
This shift is not theoretical. Regulators are increasingly treating demand flexibility as a practical way to make better use of existing grid assets.
California has adopted a statewide goal to make up to 7,000 MW of electricity available by 2030 through smarter use of existing resources, including load shifting.
The direction is clear: utilities will need to serve load growth while managing grid constraints, cost pressure, and local infrastructure limitations. Building more infrastructure will remain essential, but it cannot be the only lever. Utilities also need to unlock the flexibility already embedded across the grid edge.
That requires precision.
Instead of “how much demand response do we have?” the question becomes “which customers, on which assets, during which hours, can create measurable headroom?”
Grid Intelligence turns AMI data into hidden headroom
The data needed to answer those questions is already flowing through infrastructure utilities that have spent billions of dollars deploying.
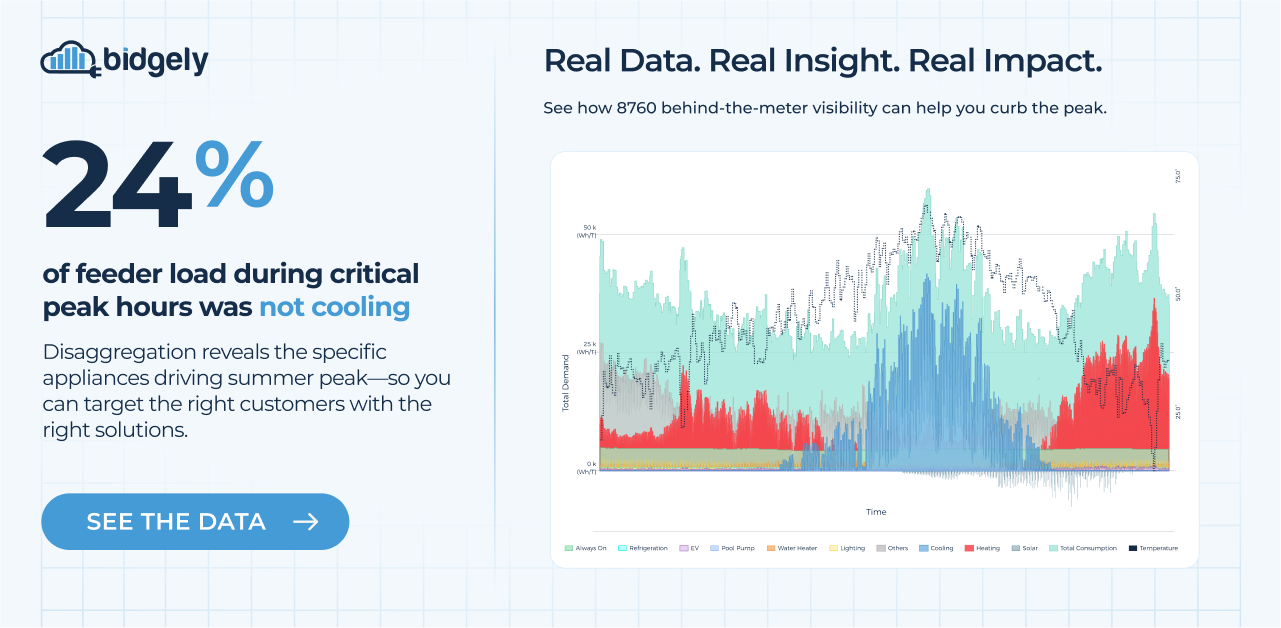
Bidgely Grid Intelligence turns AMI data into asset-level visibility utilities can act on. By mapping meter-level load intelligence to feeders, transformers, and substations, utilities can identify which assets ran hottest during a summer peak, what load types drove the constraint, where EV charging or DER adoption is clustering, and which customers are strong candidates for managed charging, demand response, or targeted flexibility programs.
The goal is not simply to watch the grid strain.
The goal is to reveal hidden headroom in the form of flexible load already sitting on the distribution grid that can be targeted, enrolled, measured, and used to reduce or defer local capacity constraints.
That means utilities can move from broad peak-management programs to asset-specific flexibility strategies:
Transformer and feeder loading analytics
Identify which assets experienced the highest stress during the event and which are trending toward overload before failure or emergency intervention.
Meter-level load intelligence
Understand what is driving the local peak at the appliance level, including air conditioning, EV charging, water heating, pool pumps, or other flexible end uses.
EV and DER detection
Locate unmanaged charging, solar, batteries, and other distributed resources clustered on constrained assets.
Locational forecasting
Predict which neighborhoods, feeders, or transformers are likely to breach planning limits as electrification and load growth accelerate.
Targeted flexibility activation
Prioritize the customers most likely to create value on the exact assets that need relief.
This is where Bidgely’s behind-the-meter intelligence can make a system-level event actionable for distribution planning.
The PJM emergency shows that demand-side action matters. But the utility opportunity is at the distribution edge, converting invisible flexibility into available grid relief.
The headroom is real, but it has to be validated
Across the 50 million meters Bidgely has analyzed, we have identified approximately 10 GW of potential flexible load. It is an indicator of the scale of hidden flexibility already embedded in customer load.
The next step is to convert that potential into actionable headroom by linking four things:
1. Load intelligence
Which end uses are driving peak demand?
2. Grid location
Where are those customers connected on the distribution system?
3. Program targeting
Which customers can be engaged through managed charging, demand response, behavioral load shift, rates, DER programs, or non-wires alternatives?
4. Measurement and verification
Can the impact be measured well enough to support operations, planning, regulatory filings, and investment decisions?
An analysis based on the answers to these four questions is the difference between a theoretical flexibility estimate and a utility-grade headroom strategy.
The next summer peak is being shaped now
The June and July 2026 heatwave will not be the last. Load growth from electrification, data centers, and new customer demand is colliding with hotter summers and tighter grid operating conditions. PJM serves roughly 67 million people across the Mid-Atlantic and southern states, and Reuters reported that the system was already under pressure from data centers and EV-related demand before the heatwave.
Utilities cannot control the weather. They cannot build new infrastructure overnight. And they cannot rely only on emergency procedures when demand approaches system limits.
But they can use the data they already have to reveal the headroom they cannot currently see, feeder by feeder, transformer by transformer, and customer segment by customer segment.
The utilities that come through the next summer peak in the strongest position will be the ones that use this moment to identify where the grid is most constrained and where flexible load can create measurable relief.
The takeaway
PJM’s emergency should not only be a story about scarcity. It should also be a story about visibility.
The grid has more capacity than it appears to have because flexible load is already connected. But much of that flexibility is hidden inside customer demand, disconnected from distribution planning, and unavailable to utilities as a targeted grid resource.
Utilities cannot unlock that headroom with aggregate forecasts alone. They need to know which load can flex, where it is located, how much it can move, and which local constraint it can relieve.
Bidgely can help utilities analyze what the worst peak week looked like on their distribution grid at the asset level and identify where flexible load may create usable headroom before the next summer peak.
Ask us for a Summer Peak Stress Assessment.
← Back to Insights