“We’re seeing transformational change in all these different areas. And something that underpins all that change is technology. So to be successful, we need to be successful at that foundation — a big part of which is data,” explained Chris Campbell, Salt River Project’s Senior Director of Distribution & Technology Operations in a recent Bidgely interview. “I’ve always said that those utilities who leverage their data for operational insights will be the ones that will be really successful in these transformative efforts.”
Andrew Barrington, Products and Services Manager at Avista says that as departments share information and data-driven discoveries, it inspires new questions and prompts the rethinking of legacy problems with new approaches:
“It’s not just a single individual or a single department. It has to be cross-functional. It has to be a conversation amongst your utility,” he notes. “I’m proud to say that Avista has achieved that. We have a lot of awareness around big data. We have a functional group of about 15 users, and we meet with Bidgely every other week to come up with new use cases and talk through how we can take the data we have and elevate it further. We are able to continuously ask questions like, ‘Can we track what the potential growth is?’ or ‘Could we learn a little bit more about where this trend is going?’”
As Campbell and Barrington point out, strategic initiatives are more successful when organizations embed data as an input business-wide. In the utility sector, behind-the-meter energy intelligence derived from load disaggregation has the capacity to enhance existing grid and customer systems to maximize performance across the board.
Bidgely has long been recognized as the trailblazer in AI-based energy disaggregation, having pioneered the science and spent the last decade partnering with energy companies worldwide to refine and perfect our approach. Our patented UtilityAITM extracts crucial energy use insights from meter data, such as time of use, DER proliferation and appliance adoption.
We submitted our first meter data disaggregation patent more than 10 years ago and have since secured more than a dozen disaggregation-based patents as part of a continuously expanding treasury of data science innovation.
Now, Bidgely is introducing Disaggregation as a Service (Daas), making the same patented AI-powered energy intelligence used in our own UtilityAI solutions available in API format for utilities and their partners to consume across a wide range of use cases. Our goal is to maximize the availability of the data and democratize behind-the-meter data use across the industry.
With DaaS, utilities and energy retailers are able to leverage highly accurate energy intelligence across operational areas. They can empower their vendors with the same data insights to ensure all utility-affiliated programs and messaging are personalized, targeted, less costly, more effective, and consistent.
Consistency across utility-customer interactions is very important. Historically, a utility may have had multiple departments and vendors engaging with customers across different programs. Each stakeholder likely used their own technology, which made it more likely that customers would receive conflicting messages. By contrast, when all parties are operating from the same DaaS-informed ground truth, customer touchpoints reinforce one another and contribute to the collective success of all programs.
A broad ecosystem of energy industry partners can benefit from DaaS to unlock additional value delivered by their solutions.
1) Customer Engagement and Customer Satisfaction
Even as one of the industry’s leaders in customer engagement and satisfaction solutions, we recognize we can’t cover the entire utility-customer relationship. So we want to enable other energy customer engagement players and vendors with DaaS to build personalization into every customer’s interaction — from the call center to digital platforms.
2) Cloud Partners
We see Snowflake, Amazon, Google, Azure and others helping utilities migrate their data and solutions from on-prem to the cloud. Working through those partners, DaaS can leverage their data management ecosystems to extract insights rapidly.
3) Targeting
When it comes to demand response programs and recruiting customers into thermostat, water heater, pool pump, heat pump and other device upgrade programs, DaaS can make targeting the right customers easy — i.e. only those who actually need a new device or appliance based on actual energy performance data.
DaaS reveals which customers have degrading appliances, pools, electric vehicles and more. As a result, utilities can avoid spending hundreds of thousands of dollars on Google AdWords, Facebook ads and other traditional mass marketing tactics because they know exactly which customers are best-suited for a given program and can target them directly.
There are a wide range of vendors supporting the industry in planning for the grid of the future by striving to answer critical questions about when existing infrastructure is likely to degrade and where new infrastructure investments should be made.
The appliance-level insights that disaggregation reveals can be aggregated to provide actionable intelligence about grid assets, such as feeders and substations. With DaaS, utilities can bolster their grid planning solutions with a bottom-up, granular understanding of grid load.
For example, EV load forecasting is more accurate when based on current adoption patterns as evidenced by household energy use. If the current EV growth rate in a given area is accelerating rapidly, it may signal that in 12 to 18 months, a utility could run out of capacity in that area. DaaS can help expose those real-world EV proliferation trends so planners can understand their impacts reliably and act accordingly.
DaaS is available to utilities and energy retailers worldwide. Bidgely is currently working in 12 countries on six continents and can stand up DaaS in new regions on a rapid timeline. Though access to data and methodologies used by utilities and energy retailers vary by location, what doesn’t change is the value of Bidgely’s UtiltyAI disaggregation technology to engage modern energy consumers and make the grid more resilient.
If you’d like to explore more DaaS use cases and how the partners in your ecosystem can benefit from infusing Bidgely’s energy insights into their products, we’d love to hear from you.
How Rocky Mountain Power boosted SMB CSAT with Business Energy Reports
The 2023 J.D. Power Electric Utility Business Customer Satisfaction Study highlighted a concerning drop in business customer satisfaction (CSAT) among electric utilities, finding CSAT is at an all-time low of 754 on a 1,000-point scale.
However, despite this cautionary assessment, the report was decidedly optimistic about the future, suggesting that the path to reversing business CSAT decline is clear. Survey respondents overwhelmingly agreed that proven strategies like improving communication and providing more personalized service could significantly improve customer sentiment and turn things around.
In short, communication + personalization = transformational CSAT improvement.
Bidgely’s work with Rocky Mountain Power has demonstrated that this simple equation really does add up to big impact.
The utility began working with Bidgely in 2018 to advance its legacy Home Energy Reports program by leveraging disaggregation to help residential customers understand their energy usage breakdown and the associated costs.
“It was new and different, and it created a lot of engagement that generally created action. Customers were more aware, and it motivated them to make different energy use decisions,” explains Shawn Grant, Customer Innovations Manager at Rocky Mountain Power.
Improved customer engagement and expanded participation resulted in significant, measurable savings. In less than one year, customers were empowered to save 41GWhs of energy — including savings of one percent among average consumption customers.
Building on this residential HER program success, the utility set out to achieve similar benefits for its commercial customers.
“In 2020, we worked with Bidgely to create digital Business Energy Reports that went out to our small- and medium-sized business customers in three states — Utah, Idaho and Wyoming,” says Barb Modey, Customer Satisfaction Market Research Manager at PacifiCorp. “And the SMB engagement was really more than we expected. We didn’t use it as a savings tool. We pushed out communications that were not necessarily traditional energy efficiency messages.
“Instead, we sent messages about reliability, pricing, or community involvement — just a variety of things that we wanted our customers to know about. And after a full year of these reports, in 2021 we received our best JD Power business scores ever. In fact, it was just striking — it was a 35 point jump. We went from number 10 in the West up to the number two spot, and from number 54 to number 9 nationally. The Business Energy Reports worked so well that we rolled the program out to our sister company PacificPower the following year.”
Modey credits the consistent cadence of monthly communications for boosting overall engagement.
“Before we introduced Business Energy Reports, our communication with SMB customers was sporadic. We would come up with campaigns and have short bursts of contact with them either through direct mail or email, but then it would stop. It wasn’t a continuous effort. But now our reports go out twice a month, automatically. They hear from us consistently, month-after-month.
Interestingly, SMB customers who received the business energy reports also demonstrated an increase in awareness and satisfaction in unexpected areas.
“In our surveys, customers who had received the Business Energy Reports had higher scores across a wide range of measures — not just energy efficiency, but also environmental awareness, awareness about reliability pricing, and even better experiences with outages,” Modey says. “
“When we worked with Bidgely to design our reports, we decided to treat it as a marketing program, rather than as a savings program. That gave us a lot of freedom to not only fund it, but also to include messaging that might not be considered purely DSM [Demand-Side Management]. So we are able to work-in messages that touch on customer satisfaction drivers. We might talk about what we’re doing to improve infrastructure and reliability, how our vegetation management crews are out there working, or what we’re doing with wildfire mitigation. We include those along with tips about signing up for energy efficiency, or incentives for HVAC or lighting or other programs they might find valuable.”
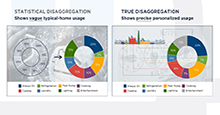
As with their residential HER program, Rocky Mountain Power leveraged disaggregation — which separates energy use into appliance categories across time — to create an accurate and actionable profile for each customer and personalize its Business Energy Reports. In the case of business customers, profiles included energy usage and time of use by appliance for heating, cooling, lighting, refrigeration, and always-on.
The data analysis further identified appliance-specific, non-operating-hours usage and on-peak usage as key commercial customer insights.
Monthly summaries like Rocky Mountain Power’s Business Energy Reports provide commercial customers with a snapshot of their monthly energy use that includes appliance-level spending.
This detailed analysis allows SMBs to identify energy efficiency and cost savings opportunities, both behavioral and appliance retrofits. It also provides a more useful means to compare current bills against historic bills, with the usage granularity needed to pinpoint exactly why a bill has gone up or down.
Beyond monthly summaries, SMB customer profiles enable utilities to identify a personalized next-best insight and interaction for every SMB, and communicate recommendations with customers via proactive alerts, such as:
• High usage alerts paired with energy efficiency programs
• Bill projections paired with better rate offerings
• A bill breakdown paired with new product offerings like solar panels, batteries, HVAC rebates, etc.
The resulting engagement program is consistent and relevant and establishes the utility as a partner that SMB customers can to rely on.
As JD Power emphasized in their survey reporting, far too many business customers are not receiving proactive outreach from their utility today, and it’s incumbent upon utilities to change that reality and establish a stronger collaboration with their high-value commercial customers.
After all, that’s just good business.
If you would like to learn more about Rocky Mountain Power’s Business Energy Reports program and Bidgely’s SMB engagement and SMB CSAT capabilities, download the Bidgely SMB Solution Brief or check out our SMB Solutions page.
Hear more from PacifiCorp’s Barb Modi by watching the on-demand webinar: “Secrets of SMB Success: Rocky Mountain Power’s Award-Winning CX.”
The most-forward thinking utilities are embracing the power of AI and big data to chart the most efficient and effective path to achieve future readiness.
Bidgely has been with Avista Utilities on its AI journey from the start. Providing electricity to nearly 403,000 customers and natural gas to ~369,000 customers across 30,000 square miles in eastern Washington, northern Idaho, and parts of southern and eastern Oregon, Avista is executing on multiple big data and AI use cases across functional areas, deploying them successfully, and scaling them across the organization for maximum grid benefit.
I had the opportunity to talk with Andrew Barrington, Products and Services Manager at Avista, to get his perspective on the utility’s journey so far, and how he sees big data continuing to transform their operations.
Andrew says Bidgely’s UtilityAI™ Analytics Workbench tool has acted as a “use case generator” for the utility. As departments share information and data-driven discoveries, it inspires new questions and prompts the rethinking of legacy problems with new approaches.
“It’s not just a single individual or a single department. It has to be cross-functional. It has to be a conversation amongst your utility,” he notes. “I’m proud to say that Avista has achieved that. We have a lot of awareness around big data. We have a functional group of about 15 users, and we meet with Bidgely every other week to come up with new use cases and talk through how we can take the data we have and elevate it further. We are able to continuously ask questions like, ‘Can we track what the potential growth is?’ or ‘Could we learn a little bit more about where this trend is going?”
In the past, Avista used in-house methods to create EV charging load profiles, which were informative but had limitations. These methods were restricted to known EV customers in utility programs, sometimes lacked accuracy, and demanded substantial engineering and analysis work.
I asked Andrew to share his view as to how the advanced features in BIdgely’s UtilityAI™ Analytics Workbench tool have enabled Avista to produce robust load profiles at scale, and gain deeper insights into customer charging habits, feasible load-shifting strategies, and smarter grid infrastructure planning for future EV demands.
“In 2021 we worked with Bidgely to analyze our AMI data to detect just over 600 accounts. But now we can see our growth over time to 2022 and 2023. In just three short years, we saw a growth of close to 1,300-1,500 vehicles come into our service territory. That’s fantastic insight for us to understand our EV growth. And what’s really interesting is each year EV time-of-use shift has shifted. The time of use when we started is much different than where we’re at today.”
Beyond total EV load, Avista is able to identify feeders and transformers that could come under strain due to EV proliferation.
“We have been able to leverage our meter data a step further and pinpoint our EV driving customers to specific substations, and start to determine the related strain at the meter and substation level, and even more granularly to the feeder level. In fact, we are working on going even further and getting to the transformer level for all of our detection and for our grid team.”
As part of that analysis, Andrew says Avista is better able to anticipate how EV charging is growing regionally — community-by-community.
“Our Spokane, Washington, AMI territory is very different when you look at communities in the north, south, east or west. We looked at a feeder in our South Hill region—which is typically higher income—and we saw that the EV adoption rate was five-to-one compared to communities in north Spokane. Now with that insight, we’re able to get to the feeder and substation level and identify varied growth models across our entire service territory. So, rather than having to enhance our grid across the board, instead of ripping the Band-Aid off and having to do
everything all at once, we can strategically start moving and enhancing our grid resiliency in alignment with where the growth is actually happening now and most likely to happen next.”
Active load management is another of Avista’s critical initiatives. Andrew says he appreciates that Bidgely’s Analytics Workbench allows the team to identify which customers are charging their vehicles during peak and off-peak hours.
“We can see that out of 2,300-ish EV owners, more than 2,000 are charging on-peak right now. We don’t have time-of-use rates yet, but we will in the future. So it’s very interesting to see the opportunity that we have to shift some of that load.”
Beyond grid planning, Andrew says the utility’s EV intelligence has also revolutionized its program marketing efforts.
“We had a program in 2023 through which we were paying a significant portion of the cost to enable customers to install an Avista level-two charger within their home. It was a strategic investment designed to enable us to learn more about charging behaviors and have the potential to control usage. But we only had 700 participants in that program, and we knew we had more than 700 EV customers within our service territory. We tried customer outreach, we tried doing surveys. We didn’t feel that the motor vehicle Department of Licensing was a path we wanted to go down. So we turned to Analytics Workbench, which was able to identify 1600 additional EV customers who were charging on our system. We could then target marketing campaigns to those customers to share awareness about the EV tools and resources that we were offering. Within hours, we provided corporate communications with a hyper-targeted list of account numbers, addresses, household energy usage, and their trending behavior.”
Managing HVAC load is another program area that has benefited from behind-the-meter intelligence.
“One of our first Analytics Workbench use cases was to identify which customers within our service territory were high or low efficiency in terms of HVAC. We found some of our customers were using 12,000 kWhs a year in heating, compared with customers who had very high efficiency appliances who were only using around 4,000 kWhs per year. That’s incredible. That empowered us to direct market to those customers with low-efficiency appliances. We could identify which feeder and what substation they were on, and then just fully replace their appliance. I’m able to knock on the door and give them information they need.”
Two use cases that Andrew was particularly excited to discuss are tied to the utility’s equity efforts.
When the USDA announced new grants to help utilities lower energy costs for rural communities, Avista initially didn’t think they had any communities that would qualify.
“When the federal grant came out to support customers within your service territory that spend more than 275 percent of the national average on energy with a grant, at first we didn’t think we’d have anyone who would be eligible because our rates are too low. But we ran the analysis with Analytics Workbench and within 10 minutes were able to identify 90 customers within one zip code that were qualified. So now we’ve got grant writers working on submitting for these grants. Without this tool, we would have discounted it. We would have said no to the opportunity.”
“We also have a Clean Energy Transformation Act (CETA) in Washington State that is focused on our low-income, vulnerable customers. We gave Bidgely a list of 150,000 accounts that are within that named community and were able to identify customers within the top 30 percent of heating usage or cooling loads. Now, we can go in and completely replace those appliances for those customers.”
We hold bi-weekly working sessions with the Avista team to brainstorm new use cases and explore how to capture more value from behind-the-meter data to address their most pressing challenges. Andrew says those conversations, together with the discussions they now regularly have internally, are key to Avista’s continuing innovation.
“A big piece of our success is the cross functional collaboration this data allows. In my role, I am heavily involved with our energy efficiency, account and regional business managers, so I get looped into a lot of different conversations where my colleagues are saying, ‘It’d be great if we could do this.’ I get to raise my hand and say, ‘Hey, I think we can.’ It’s critical to make meter data available as a use case generator across the organization. You can’t just silo it within a single department, you have to share that awareness to achieve the maximum benefit.”
To hear more from Andrew Barrington about the Avista AMI data-driven approach, watch our on-demand webinar Seize the Data: Optimizing Grid and Customer Programs in 2024. To explore how to leverage AI and big data to improve future-readiness at your utility, connect with our team at [email protected].
For example, as millions of customers adopt electric vehicles and generate a growing percentage of our electricity needs, the growing demand-supply imbalance is increasing stress on the grid infrastructure. To manage the grid impacts of electrification and renewable energy adoption, Bidgely is equipping utilities with our patented out-of-the-box UtilityAI™ platform, informed by trillions of data points from millions of households worldwide.
UtilityAI equips utilities with the energy intelligence they need to evolve, prioritize investments, and achieve greater efficiency, resilience and growth. We’re empowering our utility partners to achieve clean energy goals on an accelerated timeline, while helping them mitigate grid disruptions and improve operational efficiency. Utility teams are able to focus on higher-value work that better aligns with imperatives like decarbonization and establishing the customer engagement that will make the energy transition possible.
But how did we get here, and what does the future of energy AI hold?
The dawn of the science of AI can be traced back to the 1940s, and it has been steadily evolving for nearly 70 years. But it was not until the 1990s — the decade when IBM’s Deep Blue defeated world chess champion Gary Kaparov — when computers offered enough computational power to leverage AI’s potential.
Even then, AI remained a niche technology. It was only when big data began to emerge in the early 2000s that the science of AI could, for the first time, be broadly applied to optimize business operations across industries. Apple integrated Siri into its
iPhones, IBM Watson won Jeopardy, and Google’s AlphaGo won the World Go Championship.
In 2012, just as the use of AI in business applications began to explode, Bidgely was founded. Our mission was to offer an out-of-the-box AI platform designed to solve the utility industry’s biggest challenges — especially as those challenges related to achieving a clean energy future. We saw a means to do that by providing utilities and consumers with energy intelligence to enable them to make smarter, data-driven energy decisions.
We earned our first energy AI patent that year for “systems and methods for improving the accuracy of appliance level disaggregation in non-intrusive appliance load monitoring techniques” (US9612286B2). Since then, as the leader in AI-based, behind-the-meter data science, we’ve added 16 additional patents to a growing treasury of innovation.
One of our earliest advances was the ability to perform “unsupervised clustering” of energy use data. Historically, human beings had to evaluate datasets and manually assign them a category. With unsupervised clustering, machine learning assigns datasets to categories without human intervention. In the utility space, Bidgely used unsupervised clustering to disaggregate household energy consumption at the appliance level. Using signatures unique to every appliance, our algorithms are able to determine not only which appliances were present in a home, but also how much energy each appliance consumes, and when they turn on and off. Every time the platform engages in unsupervised clustering, the fidelity of our models improves, and the platform automatically categorizes and labels datasets with greater and greater accuracy.
Over time, we incorporated other machine learning techniques related to pattern recognition and time series data analysis. Using a combination of AI approaches, we are able to detect when a pool pump, HVAC system or other specific appliance is running, determine whether an appliance is running efficiently, identify whether a household has purchased an EV or solar or reveal when the home owners are on vacation. And we continue to be able to deliver energy intelligence with very high accuracy — 90+% for appliance detection and 85+% accuracy for appliance consumption. By rolling up massive datasets at a zip code level, we can accurately predict future energy trends across multiple homes, communities, and entire service territories.
2023 was the breakout year for generative AI. And while it feels unprecedented and revolutionary, some argue that it can be viewed as a logical next step in the evolution of machine learning.
Recognizing the pivotal impact of the technology, Capgemini Research Institute reports that 33 percent of utility and energy companies worldwide have begun to pilot GPT solutions, and nearly 40 percent of utility and energy companies have established a dedicated team and budget for generative AI.
But what does generative AI mean for utilities? Why is it a game-changer? How does what we can achieve with generative AI compare to traditional AI algorithms?
Traditional AI has proven essential in empowering utilities with an accurate means to detect appliances, profile household consumption, granularly segment customers, more intelligently plan grid infrastructure, and more. Now, generative AI promises to further amplify operations.
To understand the potential, it is useful to take a closer look at how the human brain works.
Our brains can store approximately one terabyte of data. Which begs the question, with that limitation, how did we get to where we are today? How were we able to put humans on the moon? How are we able to send spacecraft to Mars and beyond? How are we able to build massive buildings and bridges?
The answer lies in what is known as reductionism. Our brain doesn’t store all the data we need to achieve great feats. Instead, we use mental models to approximate the data and we leverage creativity to extrapolate and fill the gaps in our mental models.
That’s what generative AI does as well.
If you show a traditional AI algorithm an elephant, it will capture every pixel on that elephant and describe the animal in excruciating detail. And if you ask a traditional AI algorithm to draw an elephant, it will draw more or less the same elephant over and over again.
Generative AI, on the other hand, builds a model of an elephant. It “models” the elephant as an animal that has big fan-like ears, pillar-like legs, and a rope-like tail. And if you ask generative AI to draw an elephant, the animal will look different each time. Sometimes the trunk might be in the wrong place, for example. But that’s how generative AI shows its creativity. And that is why generative AI can create realistic looking photos that may be absolutely impossible, like an elephant standing on the wing of a plane.
What we’re trying to achieve with generative AI is incremental creativity (or as I call it, ‘duct tape creativity’) to fix the problems around us.
Bidgely realizes GPT is a game changer. We have already started innovating in this space with our “EnerGPT” application and are exploring a wide-range of potential generative AI use cases.
Consider the impact of GPT on customer experience. A customer becomes alarmed that his or her electricity bill is much higher than normal. Enter EnerGPT. The customer tells EnerGPT that something abnormal is happening this month. EnerGPT analyzes the customer’s energy data and provides a natural language response to confirm that the customer’s costs have gone up nearly 40 percent even though the household usage is normal, indicating something else is wrong. EnerGPT is able to determine the cause of the spike – informing the customer that the pool pump is operating during peak hours, and providing a recommended fix for the issue by reprogramming the pool pump timer so that it runs during off-peak hours.
EnerGPT will improve grid operations as well. Imagine an operational manager who is interested in learning which of the utility’s substations are seeing the highest generation from rooftop solar installations. EnerGPT is able to generate a list right away. Or if the operations manager requests the 8760 visualization of power consumption for that substation for the entire year, EnerGPT is able to generate that chart and break it down and show how the consumption has changed hour-by-hour.
EnerGPT will handle the most complex inquiries with ease. How many EVs do we have? EnerGPT will provide an accurate count and detail where they are located. How many of those EV owners have solar installed? EnerGPT will pinpoint the residences that have both an EV and solar, and can also determine when renewable generation is highest at each home to identify the optimal time for EV charging on a household-by-household basis.
With AI-powered consumption insights this advanced, utilities will be able to unlock significant financial savings. For example, EV load shifting has the potential to save utilities more $1,350 per EV every year in bulk system investments and $1,090 per EV every year in distribution system investments, which will yield growing gains as EV adoption scales.
Looking beyond economics at the bigger picture, AI is already playing a pivotal role in the clean energy transition, and with GPT, that role is poised to grow exponentially. Machine learning coupled with its incremental creativity will amplify utility’s ability to achieve their decarbonization goals and mitigate grid disruptions — all while dramatically improving operational efficiency and customer satisfaction.
Watch our on-demand webinar AI, GPT and the Utility of the Future to continue to explore this topic, and connect with our team at [email protected] to learn more about how to maximize the benefit of AI and GPT for your utility.
Given that transportation electrification is arguably the most significant industry transformation we will see in a lifetime, it’s not surprising that what we think of as common EV wisdom continues to change -– and change rapidly.
I was always a fan of the Discovery Channel television program Mythbusters where the hosts used science and logic to disprove all sorts of commonly held beliefs. But what about EV mythbusting? Given how important it is that we get it right when it comes to managing the EV revolution, it seems like a good idea to take a closer look at how utilities are currently analyzing EVs, and see how today’s EV assumptions stack up against the latest data science. So let’s dive in.
When it comes to identifying which customers own an electric vehicle, many utilities are turning to DMV data or customer surveys. Others are starting to rely on data from customers who enroll in a telematics program, believing they can extrapolate from those samples to make assumptions about their entire population.
And of course that makes sense. We’ve compiled insights from DMV data for decades, and it’s fairly easy to acquire. And customer surveys have often been the only tool we’ve had to collect information about customer energy habits and household energy use.
There’s nothing wrong with these incumbent methods. The fact is, at this stage of the EV journey, any piece of EV data that we can get is an important one.
But at the same time, it’s a myth that these data sources are sufficient.
Let’s take a closer look at DMV data, for example. A DMV report is typically a summation of vehicle types by state. Sometimes, the list includes a breakdown by model or zip code. DMV data is useful in tracking growth month-over-month or year-over-year. But it provides no value in plotting or forecasting load shape. Because the vehicles aren’t associated with specific addresses, we don’t know what time they are charging, and we can’t determine how the vehicles line up to specific grid assets. Even if the data allows targeted outreach to a particular zip code, it doesn’t provide the granularity that utilities need to make informed, data-driven decisions about the impact of EV proliferation on the grid.
What about customers who opt-in to share their charging data through APIs telematics? Obviously, pulling data from a vehicle generates the most granular high-value data available. However, customers have to opt in to provide it, which means that utilities only receive telematics data from a very small percentage of the EV drivers in their service territory.
The truth is that accurate EV detection requires coverage that is both broad and granular. DMV data is broad. Telematics data is granular. But neither delivers both.
The reality is, that only artificial intelligence and disaggregation provide the complete data picture and depth of information utilities require, including charger type, charging habits, and load profile.
Some utilities have turned to their in-house data analysts to run queries to find the EVs in their territory.
In the spirit of the Mythbusters TV show, let’s evaluate this idea by taking a deep dive into the science.
In the most basic terms, the data science known as disaggregation is the breaking apart of the energy load of any residential or business premise into the appliance-level contributions that make up the whole.
For more than a decade, Bidgely has been disaggregating smart meter data and plotting these data points over the course of a day. We are typically looking at 15-minute granularity, which reveals 96 points over the course of a day.
Throughout the day, a premise’s electricity consumption goes up and down, forming a unique shape. Within that shape, each appliance also has a unique fingerprint that we can identify.
When all of the appliance fingerprints are layered one on top of the other, it is hard to identify what appliances are present. But what our disaggregation algorithms do is isolate each layer of the total energy load. We start with always-on consumption and peel that layer away. Then we identify heating and cooling fingerprints, which reveal themselves with their temperature dependencies and cyclical on-off, on-off cycles. Then we strip away high amplitude appliances that pull a lot of power quickly, like hot water heaters, which reveal themselves with unique “pointy” load shapes. Only then can we clearly identify EV signatures, which are both high amplitude and pull power for many hours at a time.
With true disaggregation, we can see very clearly the start and end of every charging session. We are able to determine how many times a week a customer charges a vehicle, and how many kWh they are using each time and in total. We are able to determine what type of charger is in use. And ultimately, we are able to form the type of detailed EV customer persona that is essential to every aspect of successful EV load management.
To get to this level of detection takes extensive ground truth. In Bidgely’s case, we have more than 30 data scientists, 11 years of experience refining our algorithms, and over 20,000 households of EV ground truth.
Generic methodologies won’t suffice. For example, an in-house analyst may identify patterns such as consecutive reads that are above six kW for 4 times in a month. They will identify some EVs within a population, but it will also yield false positives of 75 percent or more, which makes this approach unlikely to provide value.
The reality is, even the most talented in-house teams don’t have the experience or the depth of data to accurately identify EVs from within AMI signatures. There is simply too much complexity involved in the EV data science puzzle.
Many vendors today claim 90% or 95% accuracy, which sounds like a solid track record. But here again, it’s time to turn to the science.
What do we need to be measuring? How do we define what success looks like in a data science classification algorithm? How do we know if a data science algorithm is good? Or bad? Or somewhere in between?
Let’s put this in the context of a television meteorologist. Every day that person makes a prediction as to whether it will rain tomorrow. And TV viewers usually assume he or she will be right most of the time.
But what does it look like if we actually plot the meteorologist’s predictions over time vs. the actual weather? A true positive occurs if the meteorologist predicted rain, and it did in fact rain. A false positive occurs if the meteorologist predicted rain, and no rain fell. A false negative occurs when the meteorologist predicted sunny skies, and instead we got caught in a downpour. And finally, if the forecast is for no rain, and no rain falls, we have a true negative.
We can think about EVs in this same way. Do I predict the customer has an EV? Or do I predict they don’t have an EV? And then do they actually have an EV? Or do they not have an EV?
The simplest measure of accuracy quantifies the percentage of true positives and true negatives over the total number of predictions. The higher the percentage the better.
But there are other important metrics as well.
Precision, for example, quantifies the number of times a meteorologist predicts rain and it rains, or we predict a customer has an EV and there is an EV in the household. And again, we always want to maximize this result.
Then there is recall. Here we want to understand out of all the EVs in my territory, how many am I actually able to detect. Recall is the measure of the number of your true positives over both your true positives and false negatives combined.
And finally, there’s the false positive rate.
Let’s look at this in practice.
EVs are growing in popularity, but currently most communities in the U.S. have an average of 1-2% penetration. This changes how we view success. I can easily create an algorithm that finds no one has an EV. In a territory with two percent EV adoption, I would actually be able to claim 98% accuracy for that algorithm. On the other hand, if we use a generic approach such as the one I described when we were examining Myth 2, we would have quite a few false positives, so the accuracy measure would be absolutely terrible – under 30%.
Taking it a step further, it’s important to play with the back-and-forth between false negatives and false positives. What is better for the outcome? Is it better to minimize false positives? Which means we won’t be telling customers they have an EV if they don’t, but we might also be missing a lot of customers who do have EVs. Alternatively, we might decide it’s really important to maximize the number of detections, by identifying everyone who has an EV, even if we end up suggesting to many people that they have an EV when they don’t, and increasing our false positives. (In most cases, our recommendation is to avoid false positives, because they erode consumer trust in the utility.)
The key takeaway is that to determine EV detection success requires a bigger picture understanding of what goes into an accuracy claim, as well as how measures of precision, recall and false positives figure into the equation that determines how accurate an algorithm is. A simple claim of general accuracy doesn’t equate to EV detection accuracy.
We’ve described above how EV intelligence is critical input when managing EV growth. And that is true across the board, for both customer and grid use cases, including targeted EV program marketing, EV owner engagement, EV program planning, infrastructure planning, EV growth analysis, and EV forecasting.
Given that there are such a wide range of potential EV intelligence applications, the question that we must analyze is whether the same data science approach can be employed for all.
The truth is that while it is tempting to look for a single data silver bullet, different use cases have unique EV intelligence requirements.
For example, in the context of targeted program marketing, a lower level of accuracy might be acceptable, but establishing EV customer engagement requires a much higher level of accuracy. In the first instance, we don’t need to know a great deal about the customer — only that they own an EV. Promotional language that uses more generic phrasing is acceptable – such as to recommend a new charger purchase or invite a customer to join a managed charging program.
By contrast, customer engagement requires personalized messaging, and in order for that personalized messaging to be effective, it must be accurate and highly relevant. For instance, if we tell a customer that, based on their current charging time of use, they could save $X if they were to switch to a time of use rate, or send them an alert that they’ve charged during a peak period, what we say must be true. Similarly, billing estimates have to be highly accurate. False positives, or incorrect hyper-personalized content, create a negative experience for the customer, and an increased likelihood that they will lose faith in your solution.
Identifying the precise level of accuracy required for each unique EV use case is key to successfully employing EV intelligence.
Maybe you don’t have in-house analysts, or the data team you do have is already overburdened. In either case, it’s tempting to believe that you don’t have the resources to leverage behind-the-meter EV intelligence.
At one point in time, this was likely an accurate notion. In a territory with a million customers, each one is generating ~35,000 AMI data points annually. Once we add the estimation from every single device in the home, suddenly we’re faced with crunching billions of data points. With legacy tools, analysis at this scale would require days or weeks of work.
But today, Bidgely’s UtilityAI Analytics Workbench tool is helping utilities affordably and efficiently distill those billions of data points into actionable EV intelligence, regardless of their in-house analytics capacity. Analysis that historically would have taken multiple highly skilled analysts several weeks to complete manually can now be accomplished within hours even by non-analysts.
If I am a program manager, and I’m really interested in understanding the utility’s EV load shape, a single click applies the filter I need to reveal where my EV owners are located geographically and what their load shape is. It’s also possible to map substations, feeders and transformers to EV customers in order to pinpoint where electric vehicles fall on the network, and the load shape that is occurring on each grid asset.
I invite you to visit our demo portal (contact me at [email protected] to request access) to see for yourself. Teams across the utility – including those with limited technological sophistication – can use Analytics Workbench to distill EV intelligence from AMI data and put it to work to inform and improve the complete range of EV-related use cases. It is easy for analysts and program managers alike to use the tool and its outputs to make data-driven decisions.
Learning to leverage data science to inform utility operations is a process that takes time. Given the anticipated rapid pace of transportation electrification, now is the time to inform EV programs with behind-the-meter intelligence so that you have sufficient time to design, refine, and scale.
If you are curious about how other utilities are managing their data transformation, check out the case studies, video interviews and more featured on our EV solutions web page and reach out to our team to schedule time to learn more.
And don’t forget to WATCH my webinar where I dispel these EV myths, and provide an overview of UtilityAI Analytics Workbench: EV Intelligence.
In reality, no single business will be able to change the course of climate change on its own. Rather than working in silos, we’ll only achieve progress toward a clean energy future by thinking synergistically and looking for opportunities to bring together decarbonization innovators from throughout the energy ecosystem to amplify and extend their collective impact.
Partnership between industry and consumers is also important, with both sides doing their part to reduce emissions.
That’s why Bidgely and GridX have partnered.
Bidgely’s behind-the-meter consumption insights combined with highly accurate cost insights from GridX enable utilities to deploy more sophisticated rate design, cost analysis, and hyper-personalized customer engagement that collectively empower their customers to make better energy choices to benefit their households, the grid and the planet.
“Motivating consumers to make smarter energy decisions is paramount to achieving utility decarbonization goals,” explains Chris Black, CEO of GridX. “Through our partnership with Bidgely, we are eliminating the mystery of how a consumer’s energy choices correspond to their energy bills or grid impact. This results in a win for everyone. Customers get lower bills, utilities get more life out of their existing infrastructure, and customers and utilities are in sync in achieving their decarbonization goals.”
“By providing every household with appliance-level energy insights about their usage and the associated real-time cost breakdown, utilities are able to deliver ongoing, tailored customer journeys based on each household’s unique value drivers,” adds Bidgely CEO Abhay Gupta. “Whether they are engaging with an EV driver, a family with an aging HVAC system, or a retired couple on a fixed income, Bidgely and GridX empower our utility partners to connect the dots for their customers between energy choices and energy costs, in a personalized and highly relevant way.”
Turning passive customers into engaged and happy energy participants is a fundamental part of cultivating utility-customer partnerships that move decarbonization forward.
Helping utilities design rates and customers choose rates that are best suited to their energy lifestyles is another way to foster that essential deep level of engagement.
“The Bidgely + GridX data-driven approach provides utilities with a means to infuse rate design and analysis with behind-the-meter intelligence about how customers actually use energy,” says Gupta. “With that advance, utilities are able to more accurately explore, design, evaluate, and expedite the roll-out of rates that support operational goals while also more readily meeting the needs of their customers. The resulting modern rate structures better incentivize customer action in support of what we know are among the top utility priorities: decarbonization, DER adoption and electrification.”
“When we provide customers with the means to select the right offerings for their household by easily comparing rate and program options and determining the dollar impact of their choices on their bills, the result is a more informed and satisfied customer who is motivated to make smarter energy choices,” adds Black.
What will their bill look like if they buy an EV? How might their energy costs change if they install a solar system? What could they gain if they installed a more efficient HVAC system? How much are they likely to save if they enroll in one utility program vs another? When customers have the answers to questions like these, they’re more likely to make emissions-saving decisions.
“Precisely targeting customers with customized rate and energy efficiency recommendations is an important part of achieving decarbonization targets,” emphasizes Gupta. “When we combine Bidgely’s proven capability to strategically embed rate promotion, education and enrollment within existing customer touchpoints with GridX-informed savings calculations based on each customer’s personal energy profile, customers are able to easily determine which rate will give them the greatest benefit. Educated and empowered customers make better utility partners as we collectively work toward a cleaner energy future.”
Together, Bidgely and GridX also provide utilities with powerful tools to achieve load shifting.
“Restructuring rate plans for better load shifting has become an imperative utility initiative, especially as electric vehicles, appliance electrification and weather-related grid strains become more prolific,” says Gupta. “By partnering with GridX, we are teaching consumers that when they use energy is as important as how much energy is used, and we are giving every kilowatt-hour consumed a dollar value to help drive simple and actionable behavioral changes.”
Using rates to shift demand in predictable ways by engaging customers based on appliance/DER ownership, geographic location, energy choice behaviors, and more helps utilities more strategically deploy non-wires alternatives and accelerate progress toward decarbonization.
Across the board, when it comes to customer engagement, Bidgely and GridX are empowering utilities to achieve meaningful decarbonization progress by leveraging their joint, best-of-industry, data-science-based approaches.
By combining behind-the-meter consumption insights with highly accurate cost insights, you can become better equipped to implement customer engagement and grid management programs that advance decarbonization while keeping energy reliable and affordable for consumers. Download the information sheet: Bidgely + GridX: Customer Journeys That Connect Energy Choices to Value to learn more about how the Bidgely and GridX partnership can help you make greater progress toward your decarbonization goals.
The August 2023 Customer Engagement and Experience leaderboard is the first for Guidehouse Insights, replacing the legacy Home Energy Management Providers Leaderboard with what analysts describe as a broader approach to the topic. Discreet home energy management and behavioral energy efficiency programs have become “yesterday’s news” as “conversations are shifting to more ambitious goals” such as end-to-end program management, smart home optimization, EV management and complex rate analytics.
Bidgely is called out as one of only three CE/CX providers considered by Guidehouse Insights to be in the “Leaders” category among its ranking of 14 customer engagement and experience providers across 10 essential metrics.
“These providers stand out from the competition,” notes Principal Research Analyst Michael Kelly, “because of their technological sophistication, holistic product and use case portfolios, sizable customer bases, and relative geographic reach.”
Analysts acknowledge that no one size fits all, and review each provider’s unique differentiators.
In Bidgely’s case, its leaderboard profile highlights the company’s data science leadership as the only vendor offering AI-based, true disaggregation – unlike the static, rudimentary data models (e.g., regression models, physics-based models, statistical analysis) used by other CE/CX vendors.
The report also describes Bidgely’s position as the only vendor that has grown organically from the ground up with in-house developed solutions — a contrast to other leading vendors’ leveraging M&A for growth and technology expansion.
That advantage is evidenced not only by Bidgely’s leadership in traditional CE/CX program delivery, such as Paper HERs, eHERs, consumer web portals and call center tools, but also by its evolution to also leverage customer energy use insights to deliver advanced grid planning and management tools. In fact, the company’s modular business intelligence tool uses appliance disaggregation algorithms to generate behind-the-meter (BTM) insights in support of a wide range of utility applications, including grid analytics, EV analytics, rate design, load research, soft M&V, and DSM targeting & market segmentation.
Analysts highlight a number of ways in which leading CE/CX analytics providers are continuing to advance the segment. The Leaderboard calls out six future-ready strategies, including the three below:
1) Enterprise-Wide Visibility – Bidgely agrees with Guidehouse Insights’ analysts that consumer energy use data has become the single source of truth that should inform and enhance decision-making across the utility. By applying AI to smart meter data, energy providers can define the foundational building blocks of service territory energy use: the consumption of individual appliances within a home. These appliance-level insight building blocks can then be aggregated to provide actionable intelligence at both the customer-segment and grid-asset-levels -– such as in connection with a specific feeder or substation. This bottom-up approach to grid management enables a deeper understanding of usage and provides insights from which every utility team can benefit.
2) EV Optimization – Customer energy use data empowers in-house data analysts to detect EVs and reveal essential EV insights from within each customer’s total raw energy consumption profile. With the world’s most sophisticated EV disaggregation, Bidgely is able to identify charger types, charger amplitude, typical hours when EV charging happens, if charging is occurring on a schedule, and monthly EV consumption — all with a very low false-negative and false-positive coverage.
With personalized EV analytics for every customer in a service territory, energy providers are able to proactively engage with all new drivers as a trusted advisor, and set them up from the start to optimally manage their EV-related energy usage. Educate drivers about EV rate plans, charging programs, optimal charging equipment and more.
Smart meter EV detection insights also serve as powerful inputs for both real time grid operations and forward-looking infrastructure planning. Utilities are able to see the total charging consumption and EV load by region, zip code, substation or feeder; the percentage of level 1 vs. level 2 chargers; EV load forecasts; percentage of on vs. off-peak charging; specific geographies with the highest charging.
3) DER/DR Program Management – As DER adoption surges, the most dramatic changes to energy supply and demand are taking shape behind the meter, which is why energy use intelligence plays such a critical role.
The most successful demand response programs leverage behind-the-meter energy use data to reveal the unique load profile and load-shifting potential of every customer, segment, grid asset and geographical region. Bidgely’s platform brings together TOU engagement, event-based behavioral demand response and EV load management strategies that leverage behind-the-meter data to empower utilities to value, design, and execute demand response programs successfully. Even as the segment evolves, analysts emphasize that though CE/CX is still a relatively nascent market trend for utilities, market forces are converging to encourage and facilitate more significant customer-centric investment.
To see a walk through Bidgely’s Customer Engagement and Experience solutions, access our demo portal. Or, click here to access the full version of Guidehouse Insights’ Customer Engagement and Experience Leaderboard.
According to the International Energy Agency, EV sales jumped from ~1 million to more than 10 million over the course of the last 5 years, including an increase of 55 percent from 2021 to 2022.
The increasing pace of transportation electrification is making managed charging an essential strategy to maintain grid resiliency. Unless we coordinate who is charging on a substation or a transformer at what time, we risk a breakdown in reliability as well as over-investment in grid infrastructure and the financial burden that would place on all customers.
“We already have 70,000 electric vehicles on the road in Washington State. And our governor has put a stake in the ground and said that there’s going to be a lot more. In fact, every new vehicle sold will need to be electric, hydrogen-fueled or hybrid with at least 50 miles of electric-only range by 2035,” says Heather Mulligan, Manager of Customer Clean Energy Solutions at Puget Sound Energy. “So we need to start thinking now about that impact on the grid and how we manage for that.”
Adam Grant , Director of Electrification & Energy Services at NV Energy emphasizes that “It’s not that EVs are coming, they’re here. And the expansion is going to happen very quickly. Because it is going to be so prevalent and affect our capacity, we want to put forth a managed charging program eventually that allows us to have a little control over when the customer charges, in part to help avoid or defer upgrades to the system to meet the demand that we know is coming. And we’ll be able to build and make sure that we are and we will be ready for it when it all comes at full speed.”
It’s important to note that not every EV driver needs to be enrolled in an active managed charging program. Instead, the most cost effective and successful programs identify those customers who will have the biggest load shift impact, either based on their usage or their location. Bidgely helps utilities accurately identify and engage these ideal target customers by applying advanced data science and AI to AMI data to reveal residential charging patterns.
For other EV drivers, demand response or “passive” managed charging programs that encourage behavior modification without direct controls can provide a secondary means to manage EV load. Bidgely’s behavioral expertise provides an invaluable tool.
In this scenario, AI-powered insights derived from AMI data enable utilities to send customers behavioral nudges through email and SMS whether or not they have enrolled in an EV program or allowed the utility to connect to their vehicle equipment. Passive managed charging can be particularly useful in support of a Time of Use program to ensure customers benefit from the rate structure.
“We know these EVs are coming, and they are going to be a demand on our system. Our biggest challenge is integrating that load on both a volume basis and on a timing basis,” says Charles Spence, Manager of Vehicle-Grid Integration Programs at Avangrid. “We have end-of–day peaks already. When people come home, they turn on their AC, the TV — all of these appliances. And now, when they plug in that EV too, it will create an issue where it’s not just the volume, it’s the time. That is what we’re trying to do with our demand response managed charging programs.”
In either case, both passive and managed charging require a new level of utility-customer partnership.
Grant says, “Overall, managed charging is a big opportunity for a utility to work with customers to support the grid.”
Utilities have realized that achieving favorable electrification outcomes requires working collaboratively with customers to help them charge at the right place and right time. The goal is to realize a mutually beneficial scenario where customers are always able to get the charge they need when and where they need it, while also doing their part to ensure the resiliency of the grid to the benefit of the larger energy community.
“I would say that in the future 25 percent of our energy capacity is going to come from the customer, and 75 percent of it will come from energy generation. And so it’s really important for us to understand and unlock that 25 percent that is in the distribution system so that we can meet our decarbonization targets,” says Larry Bekkedahl, Senior VP of Advanced Energy Delivery at Portland General Electric. “To do that, we need to know when you’re charging, how you’re charging, and, oh, by the way, do you even have an EV in your garage? If I know, and work with you, and ask you if tomorrow, from 4 to 7 p.m., if you could reduce some of your load, the customer benefits and we benefit. They’re willing to work with us.”
Data-driven managed charging programs require sophisticated disaggregation capabilities. EV signals overlap with many other appliances, requiring powerful AI for accurate EV identification.
Bidgely possesses an EV knowledge base that consists of advanced ground truth for geographies in both North America and internationally that other technology providers cannot match. Our data set allows Bidgely to pinpoint who has an EV and their monthly consumption, charger size and typical hours of charging with high confidence -– even in traditionally hard-to-detect cases. All of this intelligence is made possible without any hardware or customer inputs required.
This advanced data science foundation is empowering utilities to develop highly targeted EV managed charging programs that more successfully and economically engage EV drivers as grid resiliency partners.
As I point out in the video below, its important to identify and target those customers that will have the biggest impact when it comes time to shift that load and support the community.
This approach not only delivers greater load-shift outcomes, but also allows utilities to create 3X more cost-effective programs – shifting more load for less dollars.
To learn more about Bidgely’s EV Solution and managed charging expertise, download our Electric Vehicle Adoption Playbook.
To see a walk through of the Managed Charging Customer Journey, access our demo portal.
However, the challenge lies in isolating the right data that truly aids decision-making, while recognizing that more data doesn’t necessarily equal better data or lead to better outcomes. Utility decision-makers require access to more meaningful datasets that are designed to quickly surface relevant and actionable insights that will deliver improved results for their grid, their customer relations and their bottom-lines.
Bidgely’s next generation business intelligence platform streamlines the process of gathering relevant insights about your customers and your grid so you can achieve better outcomes. This includes being able to more confidently plan grid optimization that accounts for DER adoption and demand-side shocks, and uncovering untapped opportunities for load management.
Utility users can now use the platform to analyze end-use demand data and understand which appliances customers are using at every hour in the day. This data can be used to answer complex questions such as “how do customers respond to weather shocks compared to prolonged extreme weather and in these two scenarios which appliances are they turning on and when.”
An essential tool in a utility user’s toolbox, is an 8760 demand curve. An 8760 curve plots energy usage for every hour of every day for the entire year (24 hours x 365 days = 8760 points). These curves are used to analyze customers’ yearly consumption patterns and manage peak demand in the coming years.
Analytics Workbench 2.0 provides utility users with two 8760 curves that help them understand true customer behavior and grid capacity impacts.
The first 8760 curve visualizes total consumption over the year so users can analyze seasonal consumption trends and anomalies. Users can quickly review system-wide 8760 demand curves as well the 8760 for each transformer, feeder, substation, etc. This empowers utilities with the information they need to know what is happening on their grid at all times.
The second 8760 reflects end-use demand for every hour in the day. These end-use categories include EVs, heating, cooling, pool pumps, refrigeration, etc. Understanding how customers use energy at every hour in a day across the year provides utility users with a wealth of knowledge. Decision makers can quickly reference this hour-by-hour appliance curve to answer questions such as:
Utility decision makers face the challenge of answering complex questions and acting upon their conclusions with limited margin for error. Thus, it is crucial for them to have access to the right datasets, enabling them to ask the right questions, conduct meaningful analyses, and make informed decisions that drive tangible benefits to the grid and to their customers.
Analytics Workbench is specifically designed to provide decision makers with the necessary data and information required to effectively manage today’s energy transformation and anticipate the challenges of tomorrow.
These three trends ultimately result in the need for a much greater connection between customers and the grid, particularly to enable demand flexibility. In the past, flexibility primarily came from the supply side, as the demand side was seen as largely inflexible. However, the aforementioned trends have revealed two critical issues with the traditional approach:
Given these changes, as an industry, we need to shift from the practice of flexible supply to flexible demand. Customers and data are crucial parts of the flex demand equation.
As we approached this problem at Bidgely, we posed the question:
“how might we enable utilities to realize flexible demand with the data they already have?”
A variety of ideas emerged, and ultimately 3 innovations bubbled to the top:
In this blog post, we will dive into why DER Grid Planning needs to enable demand flexibility through bottom-up data visualization.
As we explored the challenges associated with demand flexibility, one key aspect stood out: the necessity of a data-driven approach to facilitate analysis of non-wires alternatives. The potential for significant reductions in both bulk load and localized demand is huge. RMI notes that:
“Examining just two residential appliances—air conditioning and domestic water heating—shows that ~8% of U.S. peak demand could be reduced while maintaining comfort and service quality.” [1]
However, many utilities are blind to where these flexible loads actually sit on their system and therefore they cannot appropriately plan for NWAs or even right-sized grid deployments.
This issue of visibility into the system led us to think about how to combine behind-the-meter (BTM) analytics in the form of disaggregation to grid planning and NWA analysis.
In order to provide the visibility needed we took all of the household meters on a particular circuit and performed disaggregation on each household to reveal what appliances were at the household and when the specific load was utilized.
By aggregating the 8760 load curves, along with end-use designations, from all households within the circuit, we obtained the overall load curve for that circuit. This approach allows users to pinpoint the hours of constrained grid operation over the past year and identify the potential load that can be shifted during those periods. The goal is to be able to identify if there is enough flexible load available during those constrained hours to avoid the need for costly system upgrades. While not every circuit may have the potential for non-wires alternatives, prioritizing circuits with the highest potential is essential.
To meet the needs of their customers and integrate renewable energy sources into the grid, electric utilities must prioritize demand flexibility. This requires investing in a flexible grid infrastructure, accurate demand analysis tools, and mechanisms for incentivizing customers to shift their energy usage patterns. By doing so, utilities can provide reliable, affordable, and sustainable energy to their customers.
[1] RMI’s The Economics of Demand Flexibility report
Ai is still evolving and may not be perfect. Always verify important details for accuracy.